Dynamic carrying capacity due to angiogenesis
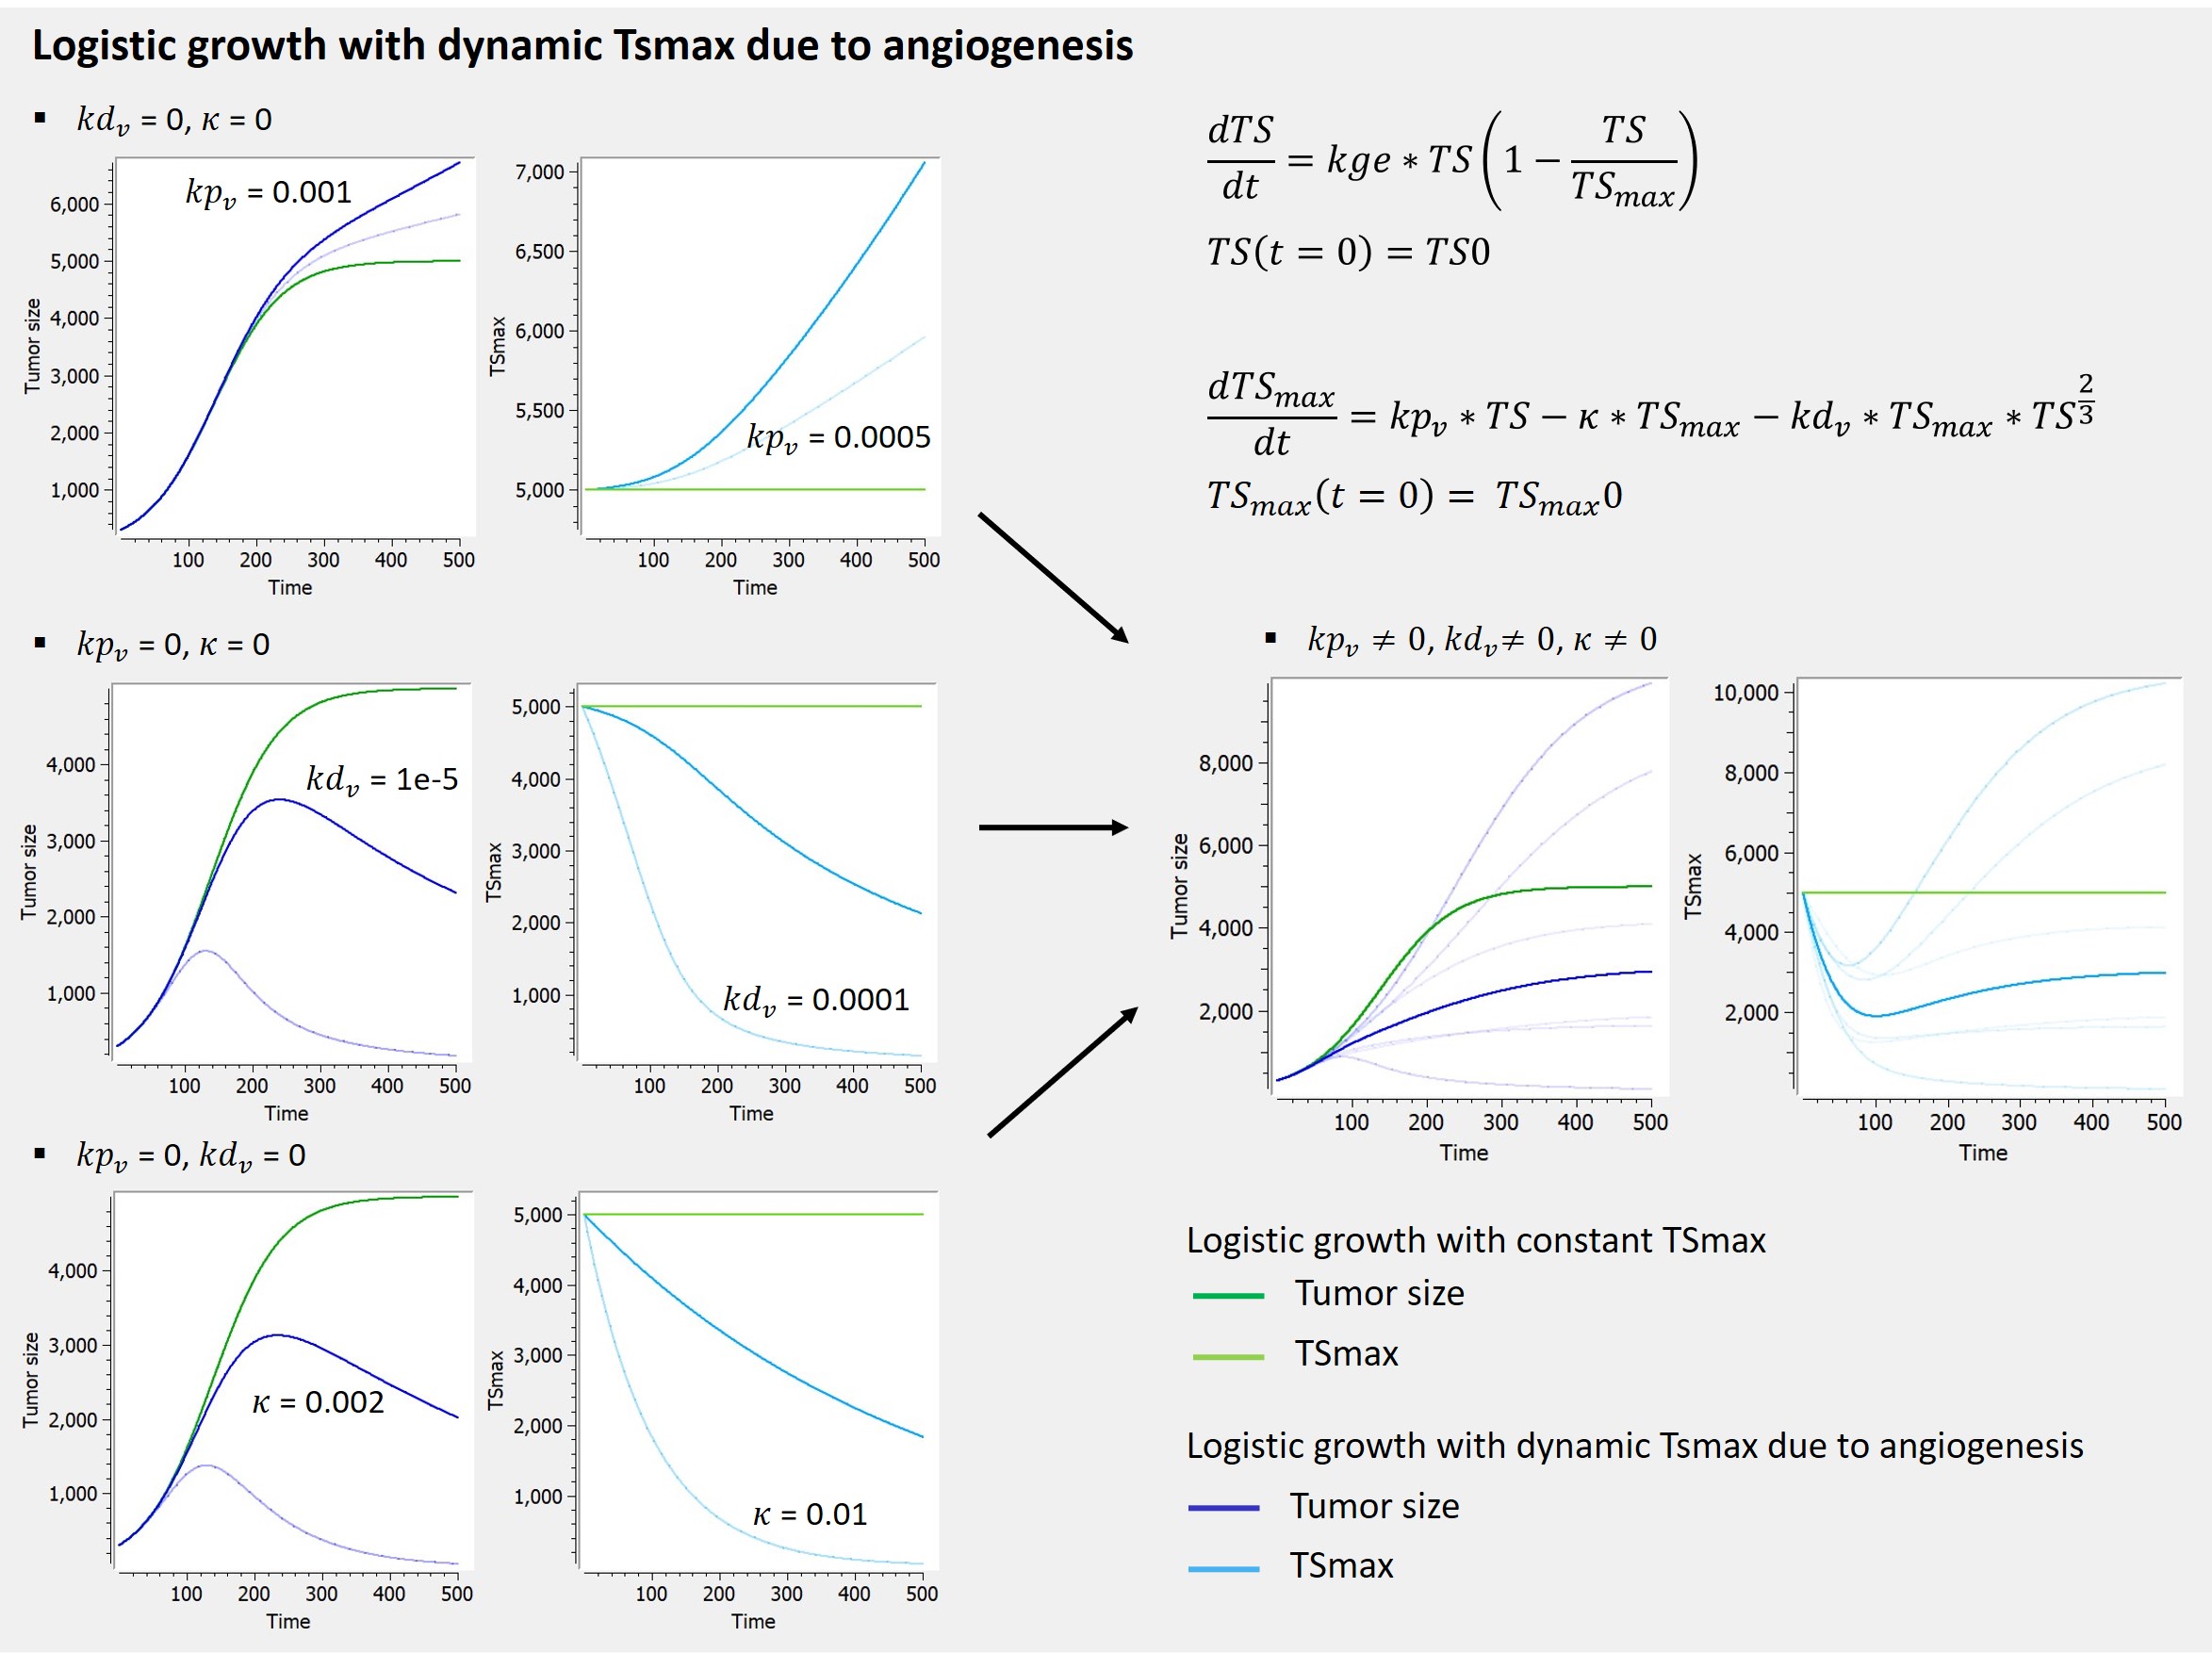
The library includes, as an example, a module taken from Hahnfeldt et al,1999 that models the effect of angiogenesis as a dynamic carrying-capacity. When selecting the dynamic carrying-capacity module, TSmax is defined as an ODE variable instead of a constant parameter, with the second ODE displayed on the figure below.
The first term () represents the stimulatory capacity of the tumor upon the vasculature via angiogenic factors. The second term (
) is an intrinsic loss rate. The third term (
) is the endogenous inhibition of previously generated vasculature by inhibition of endothelial cell proliferation, via inhibitors released through the tumor surface. When the model is combined with a cell distribution delay, the variable TS is replaced by TotalTS (i.e. the total tumour size which takes into consideration tumour cells undergoing cell death) in this ODE.
On the figure, a logistic growth is used for TS, but this module can be combined with any other tumor growth model that includes the TSmax parameter (saturation).

Immune dynamics causing shrinkage or oscillations of tumor size
Effector immune cell dynamics and their effect on the tumor cell population size may also be modelled as to allow for the production of certain clinically observed trends such as tumor dormancy, oscillation in tumor size and even spontaneous tumor regression.
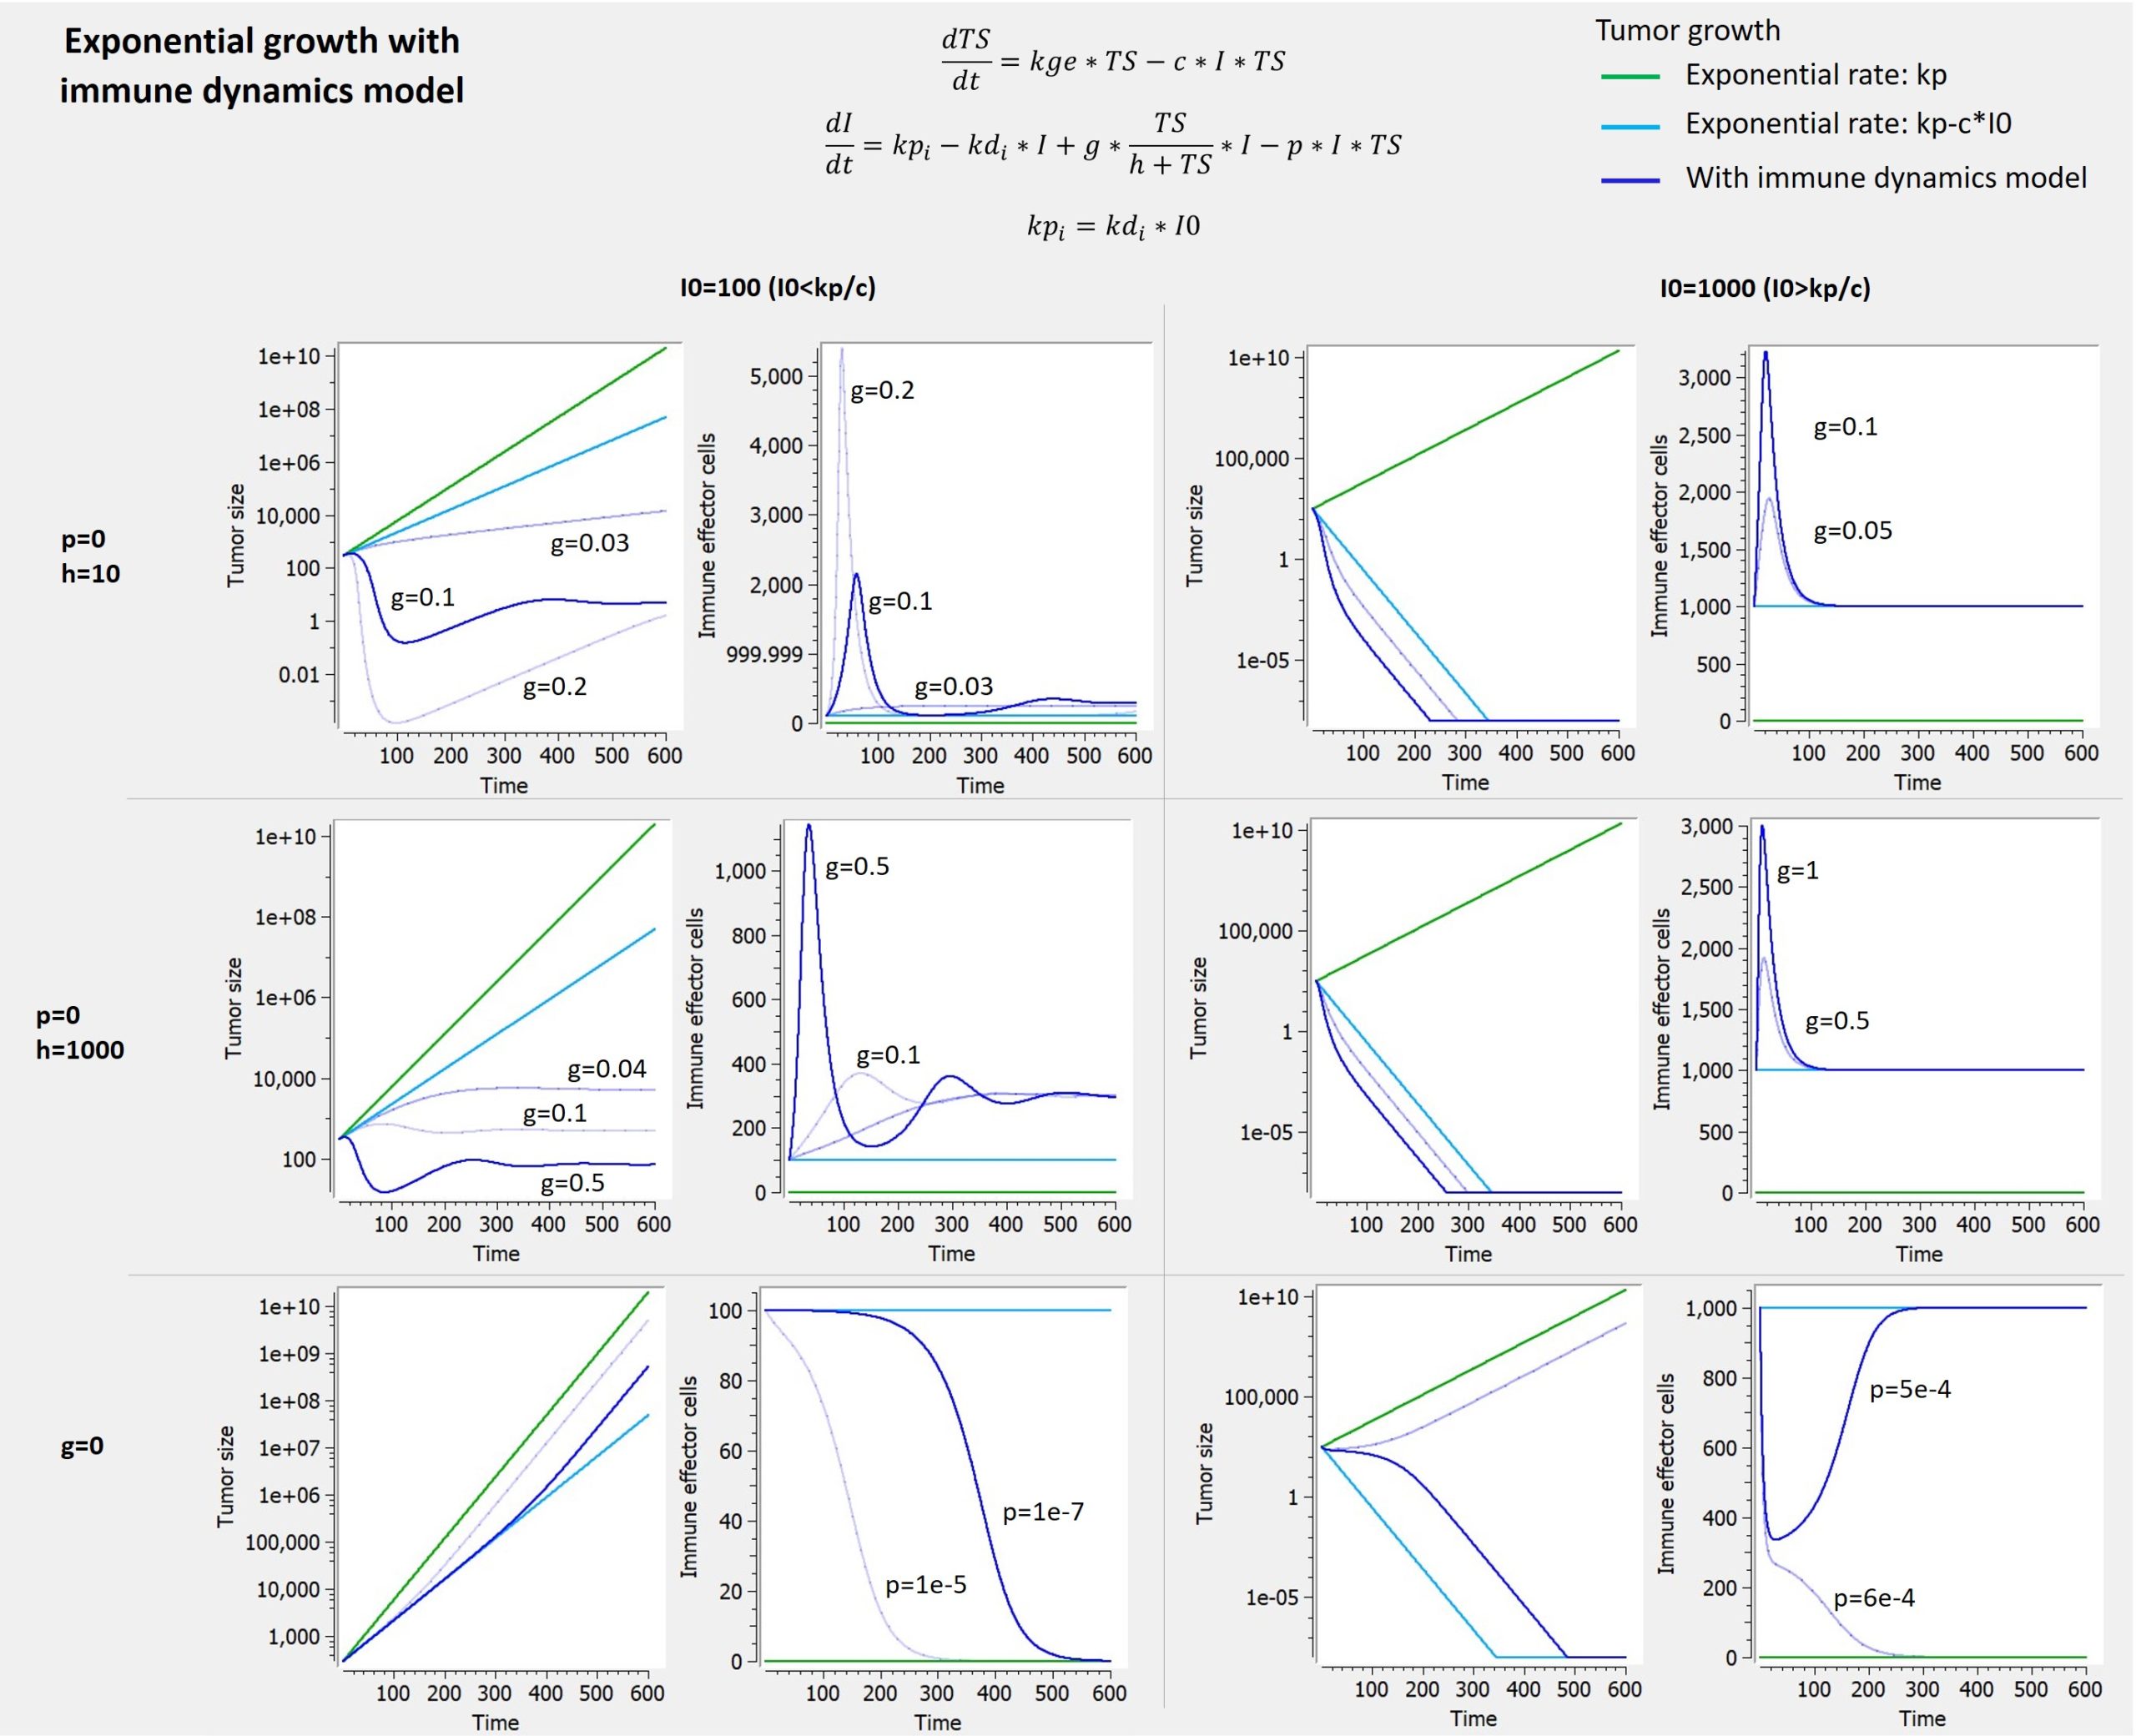
The library includes, as an example, a model of tumor-immune interactions with chemotherapy proposed by De Pillis et al. (2007), taking into account the control of the tumor growth by the immune system, and the weakening of the immune system as a side effect of chemotherapy.
In this model, tumor cells are killed by the effector cells through a mass-action dynamic with kill rate c. The effector cells have a constant source rate kpi, while death is proportional to the population of effector cells through the term -kdi*I. Effector cells are also recruited by tumor cells through a Michaelis–Menten term, which serves to provide a saturation effect. Additionally, effector cells are inactivated through contact with tumor cells according to a mass-action dynamic with parameter p.
The corresponding ODEs are displayed on the figure below, together with predictions obtained with typical parameter values, showing the impact of the different terms in the equation governing the immune effector cells dynamics and the variety of behaviors that it can cause for the tumor cells, and the immune cells.
